In September 2024, the Ministry of Economy, Trade and Industry published a report on the domestic EC market and trends in internet and smartphone usage in 2023 (Market Research Report on Electronic Commerce).
BtoC-EC market size in the goods sales sector

The growth rate of the EC market size in the physical goods sector was 4.83% year-on-year, and the growth rate is expected to slow down compared to 2022 (5.37% year-on-year). The top three industries in terms of growth rate of the EC market size in the physical goods sector in 2023 are as follows.
◆Top 3 growth rates in the physical goods sales sector of the EC market in 2023
|
1st: “Food, beverages, alcohol” +6.52% 2nd: “Cosmetics, pharmaceuticals” +5.64% 3rd: “Home appliances, AV equipment, PCs, peripherals, etc.” +5.13% |
In the 1st place “food, beverages, and alcohol” industry, the coronavirus pandemic and the resulting self-restraint on going out led to an increase in the number of consumers using online services, and this in turn promoted the shift to e-commerce. Although the growth rate slowed compared to the 9.15% growth rate in 2022, the fact that the lifestyle of buying food and beverages online is becoming more common is a good trend for the e-commerce industry.
However, the author believes that, due to the overwhelming convenience of physical stores such as supermarkets and convenience stores in Japan, it is not possible to hope for an EC rate of over 20% in the same way as in the home appliance and apparel sectors.
In the second-ranked “cosmetics and pharmaceuticals” industry, the e-commerce market in the pharmaceuticals industry in particular is becoming more active. The partial revision of the Pharmaceutical Affairs Law that came into effect on June 12, 2014 expanded the scope of online sales of pharmaceuticals, and the number of people using e-commerce increased rapidly due to the pandemic after 2020.
Furthermore, in May 2023, the new coronavirus infection was moved to Category 5, and the rules for wearing masks were relaxed, which led to a recovery in makeup demand and was a factor in the growth of the cosmetics industry market size*.
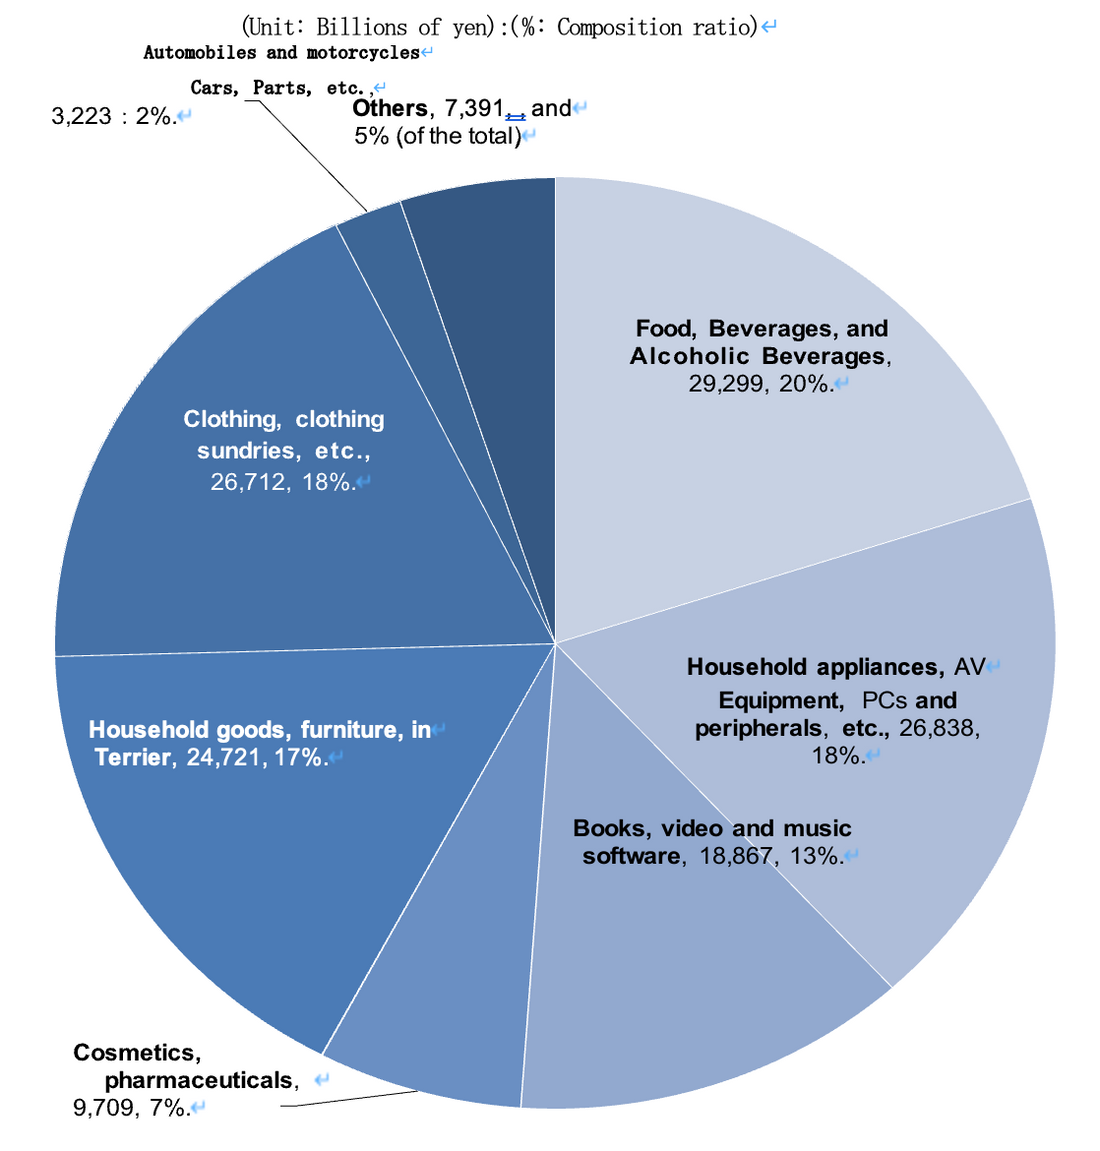
Composition ratio of each category within the Physical goods sales sector

◆Top 3 EC Conversion Rates in the Physical Goods Sector in 2023
|
1st place: “Books, video and music software” 53.45 2nd place: “Home appliances, AV equipment, PCs and peripherals, etc.” 42.88 3rd place: “Household goods, furniture, interior” 31.54 |
The above three industries have been ranked in the top three for six consecutive years. All of them were originally industries that were well-suited to e-commerce, but they have increased their user base even further due to the demand for staying at home during the coronavirus pandemic since 2020.
The two industries that ranked first and second, “Books, video and music software” and “Home appliances, AV equipment, PCs and peripherals, etc.”, are characterized by the fact that consumers often already know what they want to buy, and the value of the product itself does not change whether it is purchased from a physical store or an online store.
For this reason, as long as you know the model number (or product number), you can compare the services and prices of multiple stores online and buy from the store you like the most, so this is an industry that is very compatible with EC. In particular, the home appliance industry has a high tendency for both companies and consumers to use EC, and the EC ratio has reached 40% (42.88%).
As for the third-ranked “lifestyle goods, furniture and interior” industry, the author believes that there is still room for growth in this industry, even just looking at trends in companies like Nitori and Muji.
In the “lifestyle goods, furniture and interior” industry, companies are actively developing EC applications and promoting internet sales, but perhaps because consumers' minds have not yet caught up with companies' advanced digitization, the ratio of purchases made in physical stores remains high.
The top three industries in terms of the size of the e-commerce market in the field of physical goods sales

◆Top 3 EC market sizes in the field of merchandise sales in 2023
|
1st: “Food, beverages, and alcohol” 2.9299 trillion yen 2nd: “Home appliances, AV equipment, PCs, peripherals, etc.” 2.6838 trillion yen 3rd: “Clothing, accessories, etc.” 2.6712 trillion yen |
The rankings for “EC market scale” are the same as last year.
Because the “food, beverages, and alcohol” industry has a large market scale, even if the EC rate is low, the EC market scale will be large. Since the coronavirus pandemic, a new lifestyle of purchasing food and beverages online has been spreading. Because this field is essential for daily life, as EC use spreads, “impulse buying” in other fields is also expected.
The third-place “clothing and accessories” (apparel) industry is well-suited to Instagram, so it is easy for consumers to show their interest in brands launched by influencers with many followers or companies that have become the talk of the town, and consumer responses tend to be relatively quick.
As the market is fiercely competitive, with major fashion retailers such as UNIQLO and ZOZOTOWN battling it out, new digital systems and services are being launched one after another. It is no exaggeration to say that the apparel industry, which is constantly challenging itself to be at the forefront of new initiatives, is also playing a role in improving digital technology in the domestic BtoC-EC market as a whole.


